Students often memorize map-type definitions and still struggle to choose the right map for a question. The deeper goal is to understand that every map emphasizes some information and leaves other information out.
A strong lesson compares several maps of the same place. When the location stays constant, students can focus on how the mapmaker’s purpose changes the design.
Begin with one question, not six definitions
Show a political map and a physical map of the same state, country, or region. Ask:
- What can you learn from both maps?
- What can you learn from only one?
- Why do the maps look different even though they show the same place?
Introduce the idea that a map is an argument about what information matters. A road map makes roads easy to see. A climate map makes climate patterns easy to compare.
Teach each map type through its job
Political maps
Political maps emphasize human-made boundaries and locations such as countries, states, provinces, capitals, and cities. They help readers answer questions about jurisdiction and named places.
Physical maps
Physical maps emphasize natural features such as mountains, rivers, plains, oceans, and elevation. Color and shading often help readers see landforms.
Climate maps
Climate maps show long-term patterns in temperature, precipitation, or climate regions. Clarify that climate describes patterns over time, while weather describes shorter-term conditions.
Population maps
Population maps show where people live or how densely an area is populated. Students should check whether the map shows total population, population density, growth, or another measure.
Topographic maps
Topographic maps represent elevation and land shape, often with contour lines. At the elementary level, students can focus on the basic idea: close contour lines usually indicate a steeper slope, while wider spacing indicates a gentler slope.
Road maps
Road maps emphasize routes, connections, road types, and locations useful for travel. Modern digital maps may add live traffic or travel time, but the underlying purpose remains navigation.
Use a “best map for the question” routine
Give students a question and ask them to choose the most useful map type before looking for the answer.
Examples:
- Which states share a border with Colorado? Political map
- Where are the highest mountains in the region? Physical or topographic map
- Which route connects two cities? Road map
- Which areas receive the most rainfall? Climate map
- Where do people live most densely? Population map
More than one map may sometimes help. Ask students to justify why one would be the best starting point.
Compare the same feature across maps
Choose one region and ask students to layer information:
- Locate major cities on a political map.
- Identify nearby rivers or mountains on a physical map.
- Examine climate patterns.
- Compare population density.
- Look for possible connections.
Students might notice that cities often develop near water, transportation routes, or flatter land. Emphasize that a map can suggest a relationship, but it may not prove a single cause. Additional evidence is needed.
Teach students to read the legend and title every time
Color does not have one universal meaning. Green may show low elevation on one map, forest cover on another, and a political region on a third.
Before interpreting, students should read:
- The title
- The legend or key
- The scale
- The date, when relevant
- The source, when available
A simple class phrase can help: Title first, legend second, question third.
Use map stations without turning them into a scavenger race
Set up one station for each map type. At every station, ask the same three questions:
- What information is emphasized?
- What question could this map answer well?
- What information would require a different map?
Because the thinking routine stays the same, students can compare map types instead of merely completing unrelated tasks.
Address common misconceptions
A physical map shows only nature
Many physical maps still include cities, borders, or labels for orientation. The map type is defined by what it emphasizes, not by the total absence of other information.
A population map shows where the largest states are
Area and population are different. A small region may have many residents, while a large region may have few.
Weather and climate maps are interchangeable
A daily weather map and a long-term climate map answer different questions. Ask students to identify the time scale represented.
Topographic lines are roads or boundaries
Contour lines connect places of equal elevation. Use a model hill or stacked cardboard layers to show why the lines form nested shapes.
Assess with a map-selection challenge
Give students a set of real-world tasks and ask them to choose a map, explain the choice, and name one limitation.
For example:
A family wants to know whether a route crosses steep mountain terrain. Which maps would help, and what would each contribute?
A road map would show the route. A physical or topographic map would show terrain. The combination is more useful than either alone.
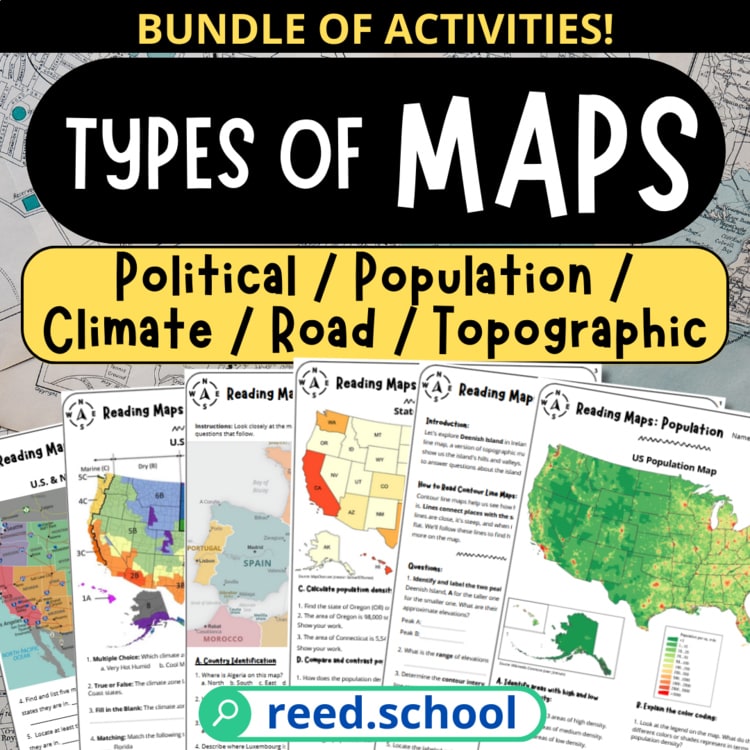
The Types of Maps Mastery Bundle gives students repeated practice with political, population, climate, topographic, and road maps. It works especially well after students understand the shared question: What was this map designed to help the reader see?